AI Redemption Strategy
Redeemly
Tech Stack
Next.js
Tailwind CSS
Framer Motion
Made In
Figma
Cursor
Fintech Product Design for Loyalty Optimization and AI-Driven Asset Management
✦ BY REDEEMLY STRATEGY
Services
Fintech Strategy
Service Design
AI Product Design
Year
2026
Problem
There is a long-standing yet underestimated structural problem in the global credit card and loyalty-program ecosystem: every year, consumers accumulate vast amounts of reward points that remain dormant, expire, or are never redeemed at all. As the credit card issuing and services market accelerates its growth (2024-2025) and continues to expand the scale of user rewards, this problem is only getting worse.
For a brand, these points represent: dormant purchasing power, wasted marketing budgets, and untapped user value.

Key facts
By 2026, the global credit card issuance service market is projected to grow to $5678.3B, with a compound annual growth rate of approximately 9.2%.


Data from the Federal Reserve Bank of New York shows that the number of credit cards in the United States has exceeded 400 million.
Gartner estimates that there are over $140 billion worth of loyalty points in the United States that remain unspent.

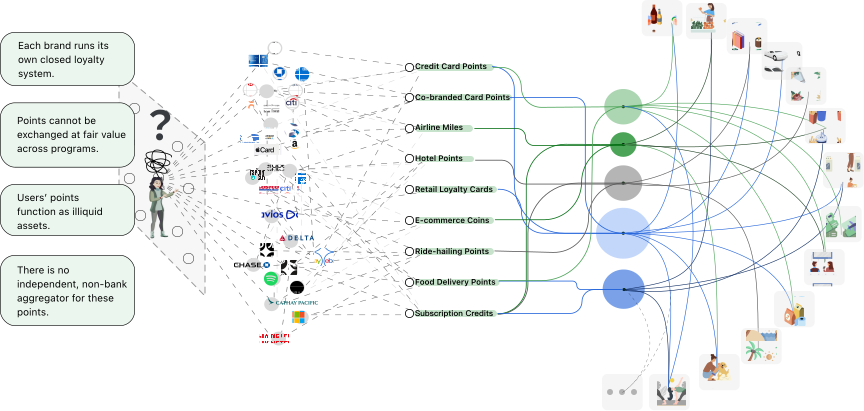
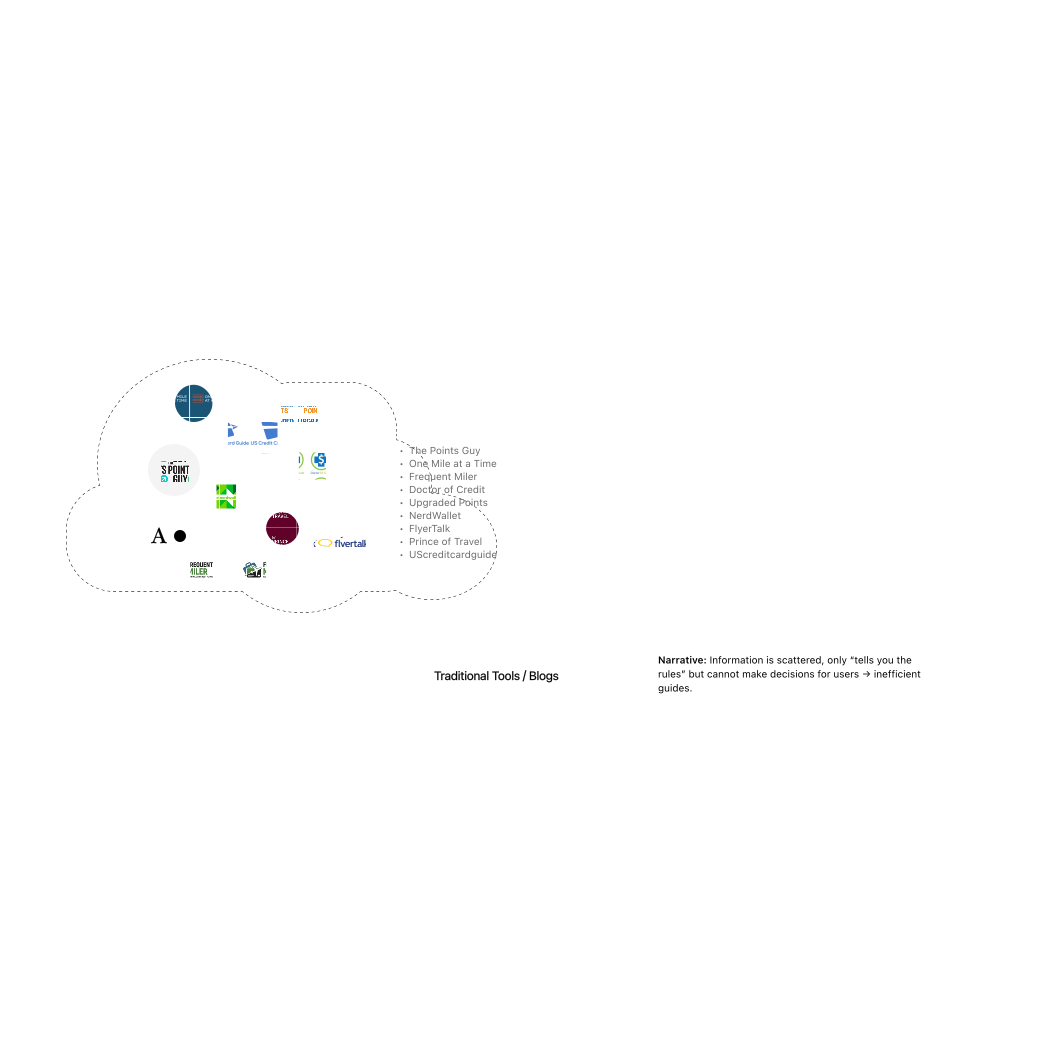
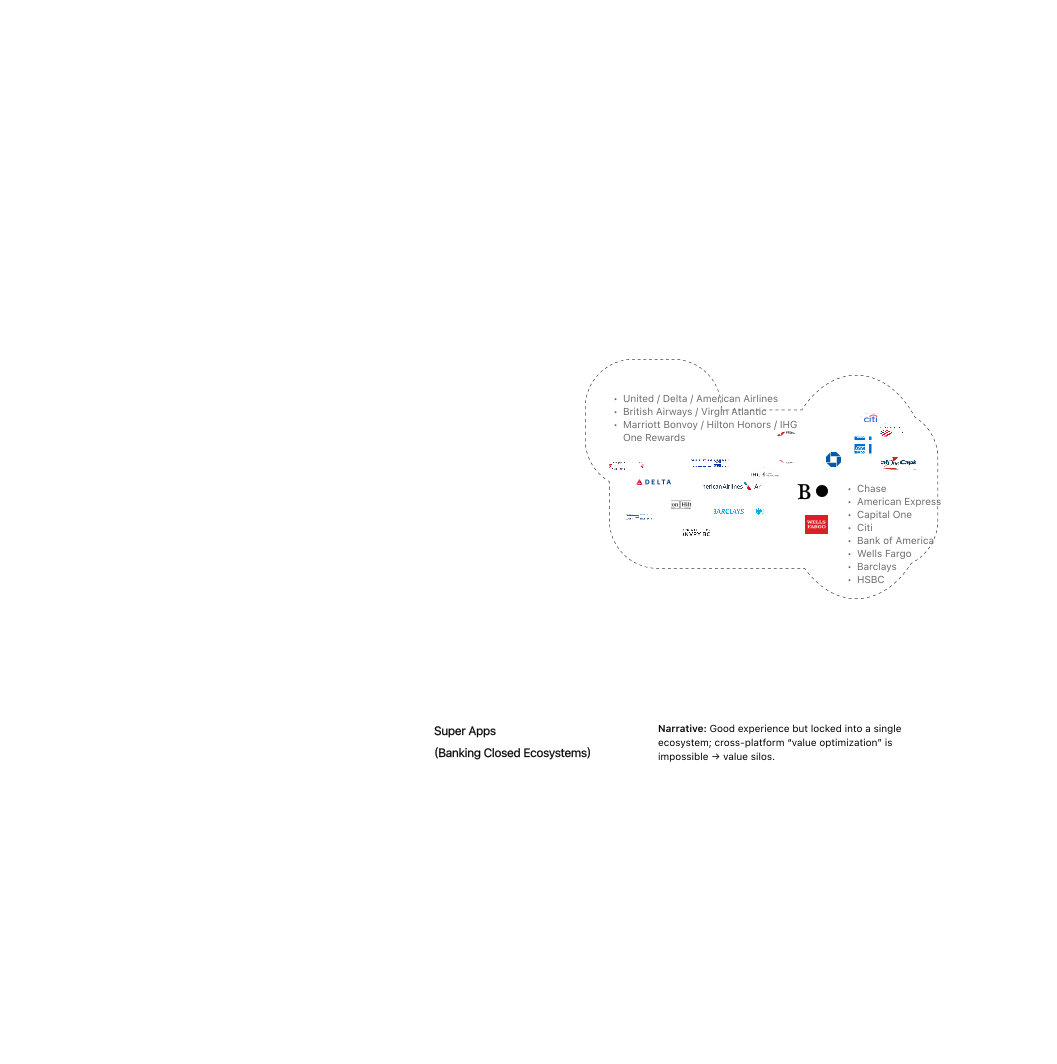
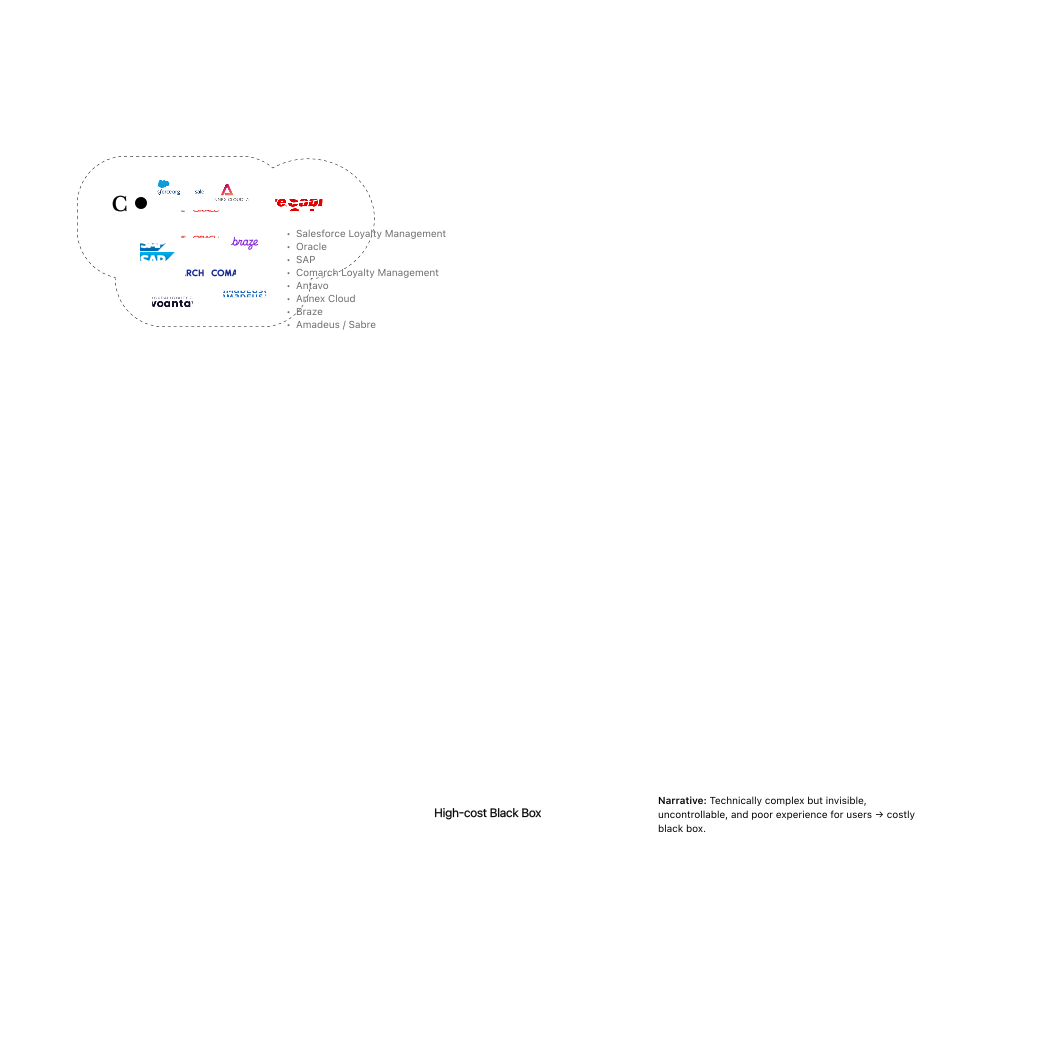
System fragmentation map
The current point-based ecosystem is a decentralized, closed network structure that is strictly dominated by merchants.
User Pain Points

Users are overwhelmed by multiple credit cards and loyalty systems with complex rules. They know they should redeem, but don't know how to get the best value.
Result: long-term neglect → point memory loss

Points fluctuate, devalue, or are restricted by complex rules. Users worry about redeeming too early or too late, so they avoid redeeming.
Result: Disengagement → eventual expiration

Unused points are illiquid assets: they can't be cashed or transferred.
Result: Economic loss for both users and brands
MVtM (Minimum Viable Target Market) Strategy
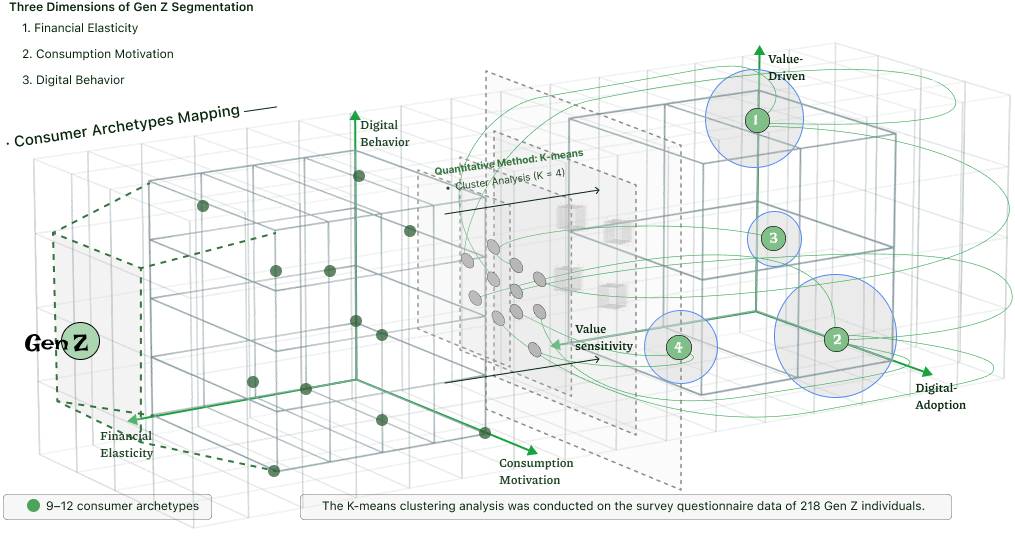
In order to identify the most promising initial entry point in the $100 billion unspent points market, this project has constructed two key identification dimensions based on secondary data analysis.
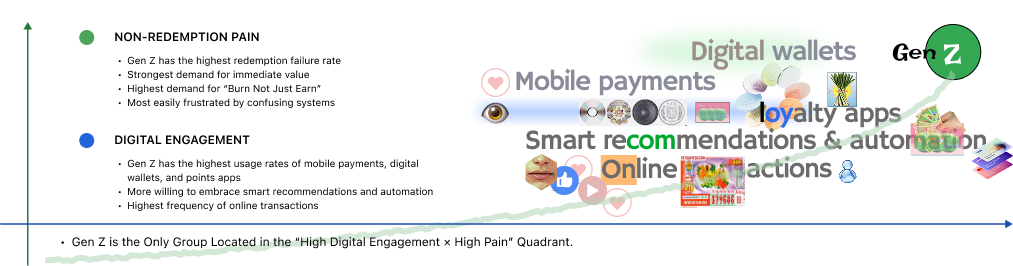
Market Segmentation Framework
In this study, we use three behavioral and motivational dimensions to break broad Gen Z down into 9–12 consumer archetypes.
Extracted via factor analysis:
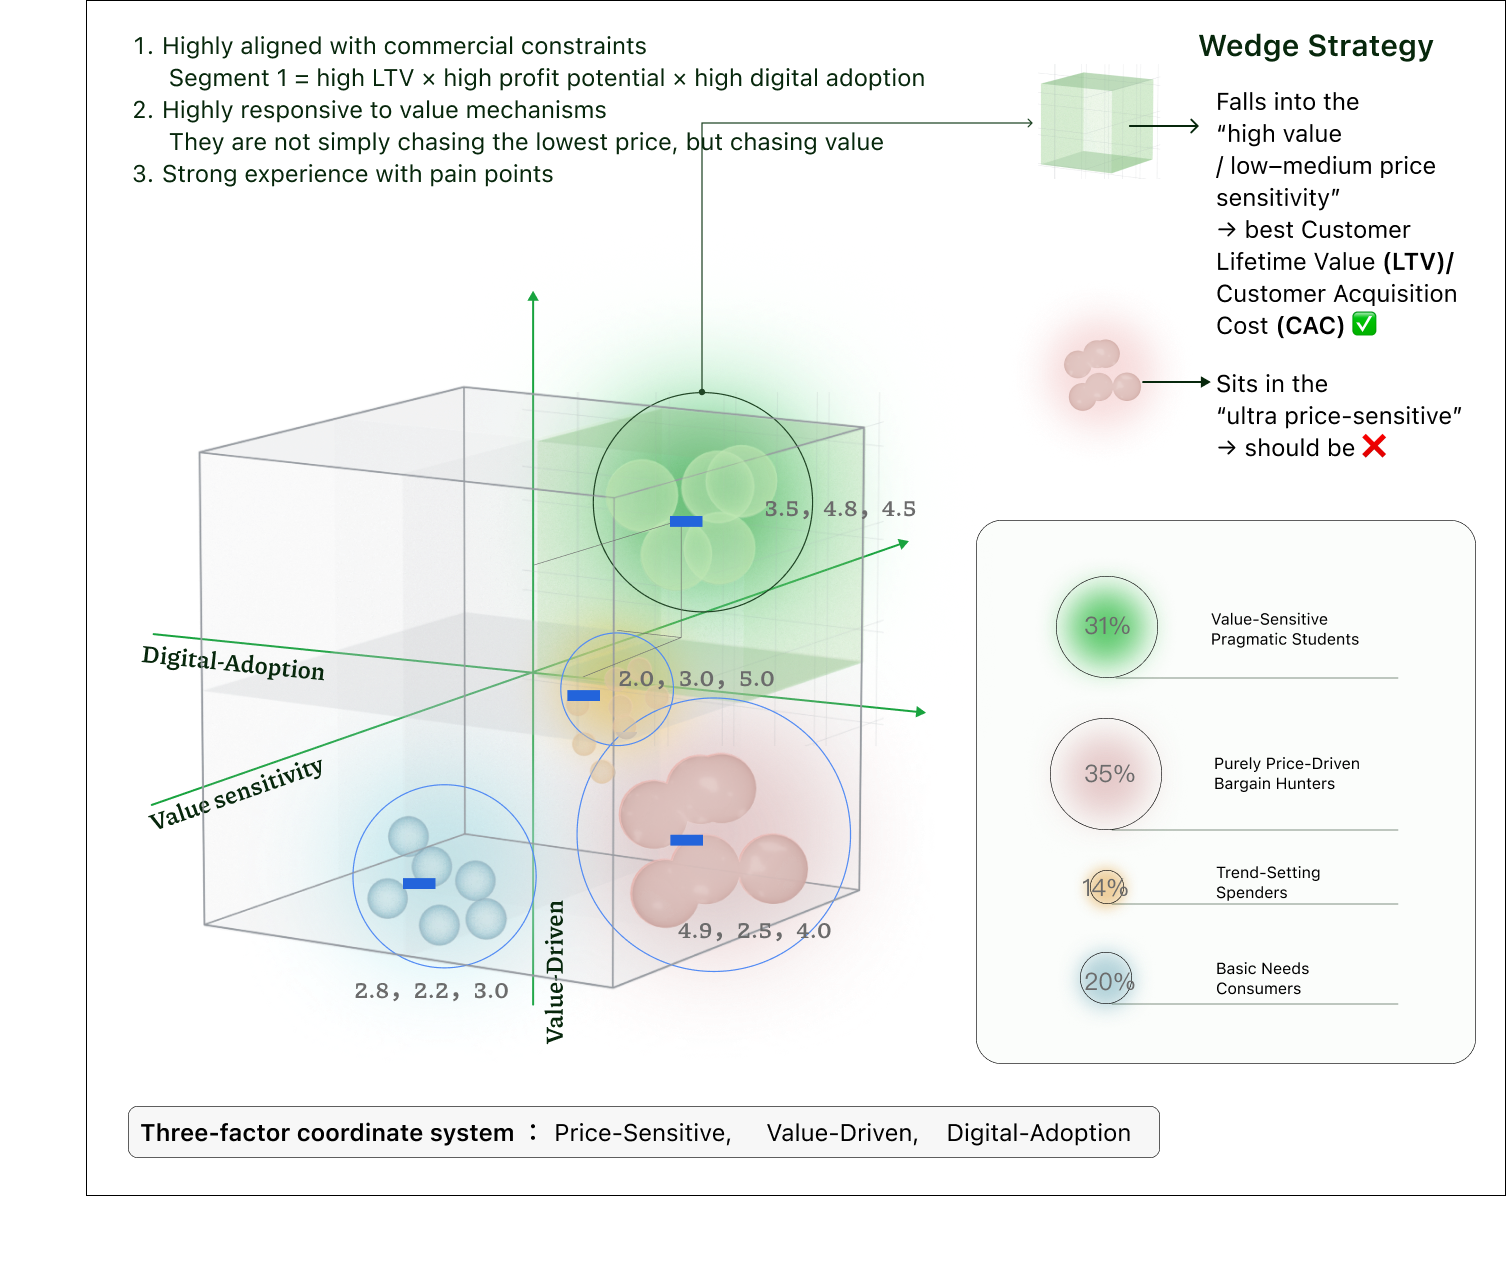
Price sensitivity | Value driven | Digital-adoption
Based on the Elbow Method and Silhouette Score, K = 4 emerged as the optimal clustering solution.
Business Goal Oriented

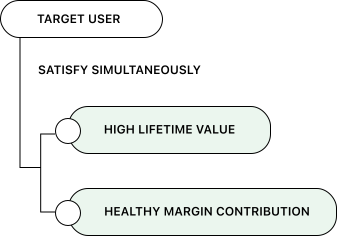
→ but to target the group with the highest value (LTV/CAC).
Wedge Strategy Mapping
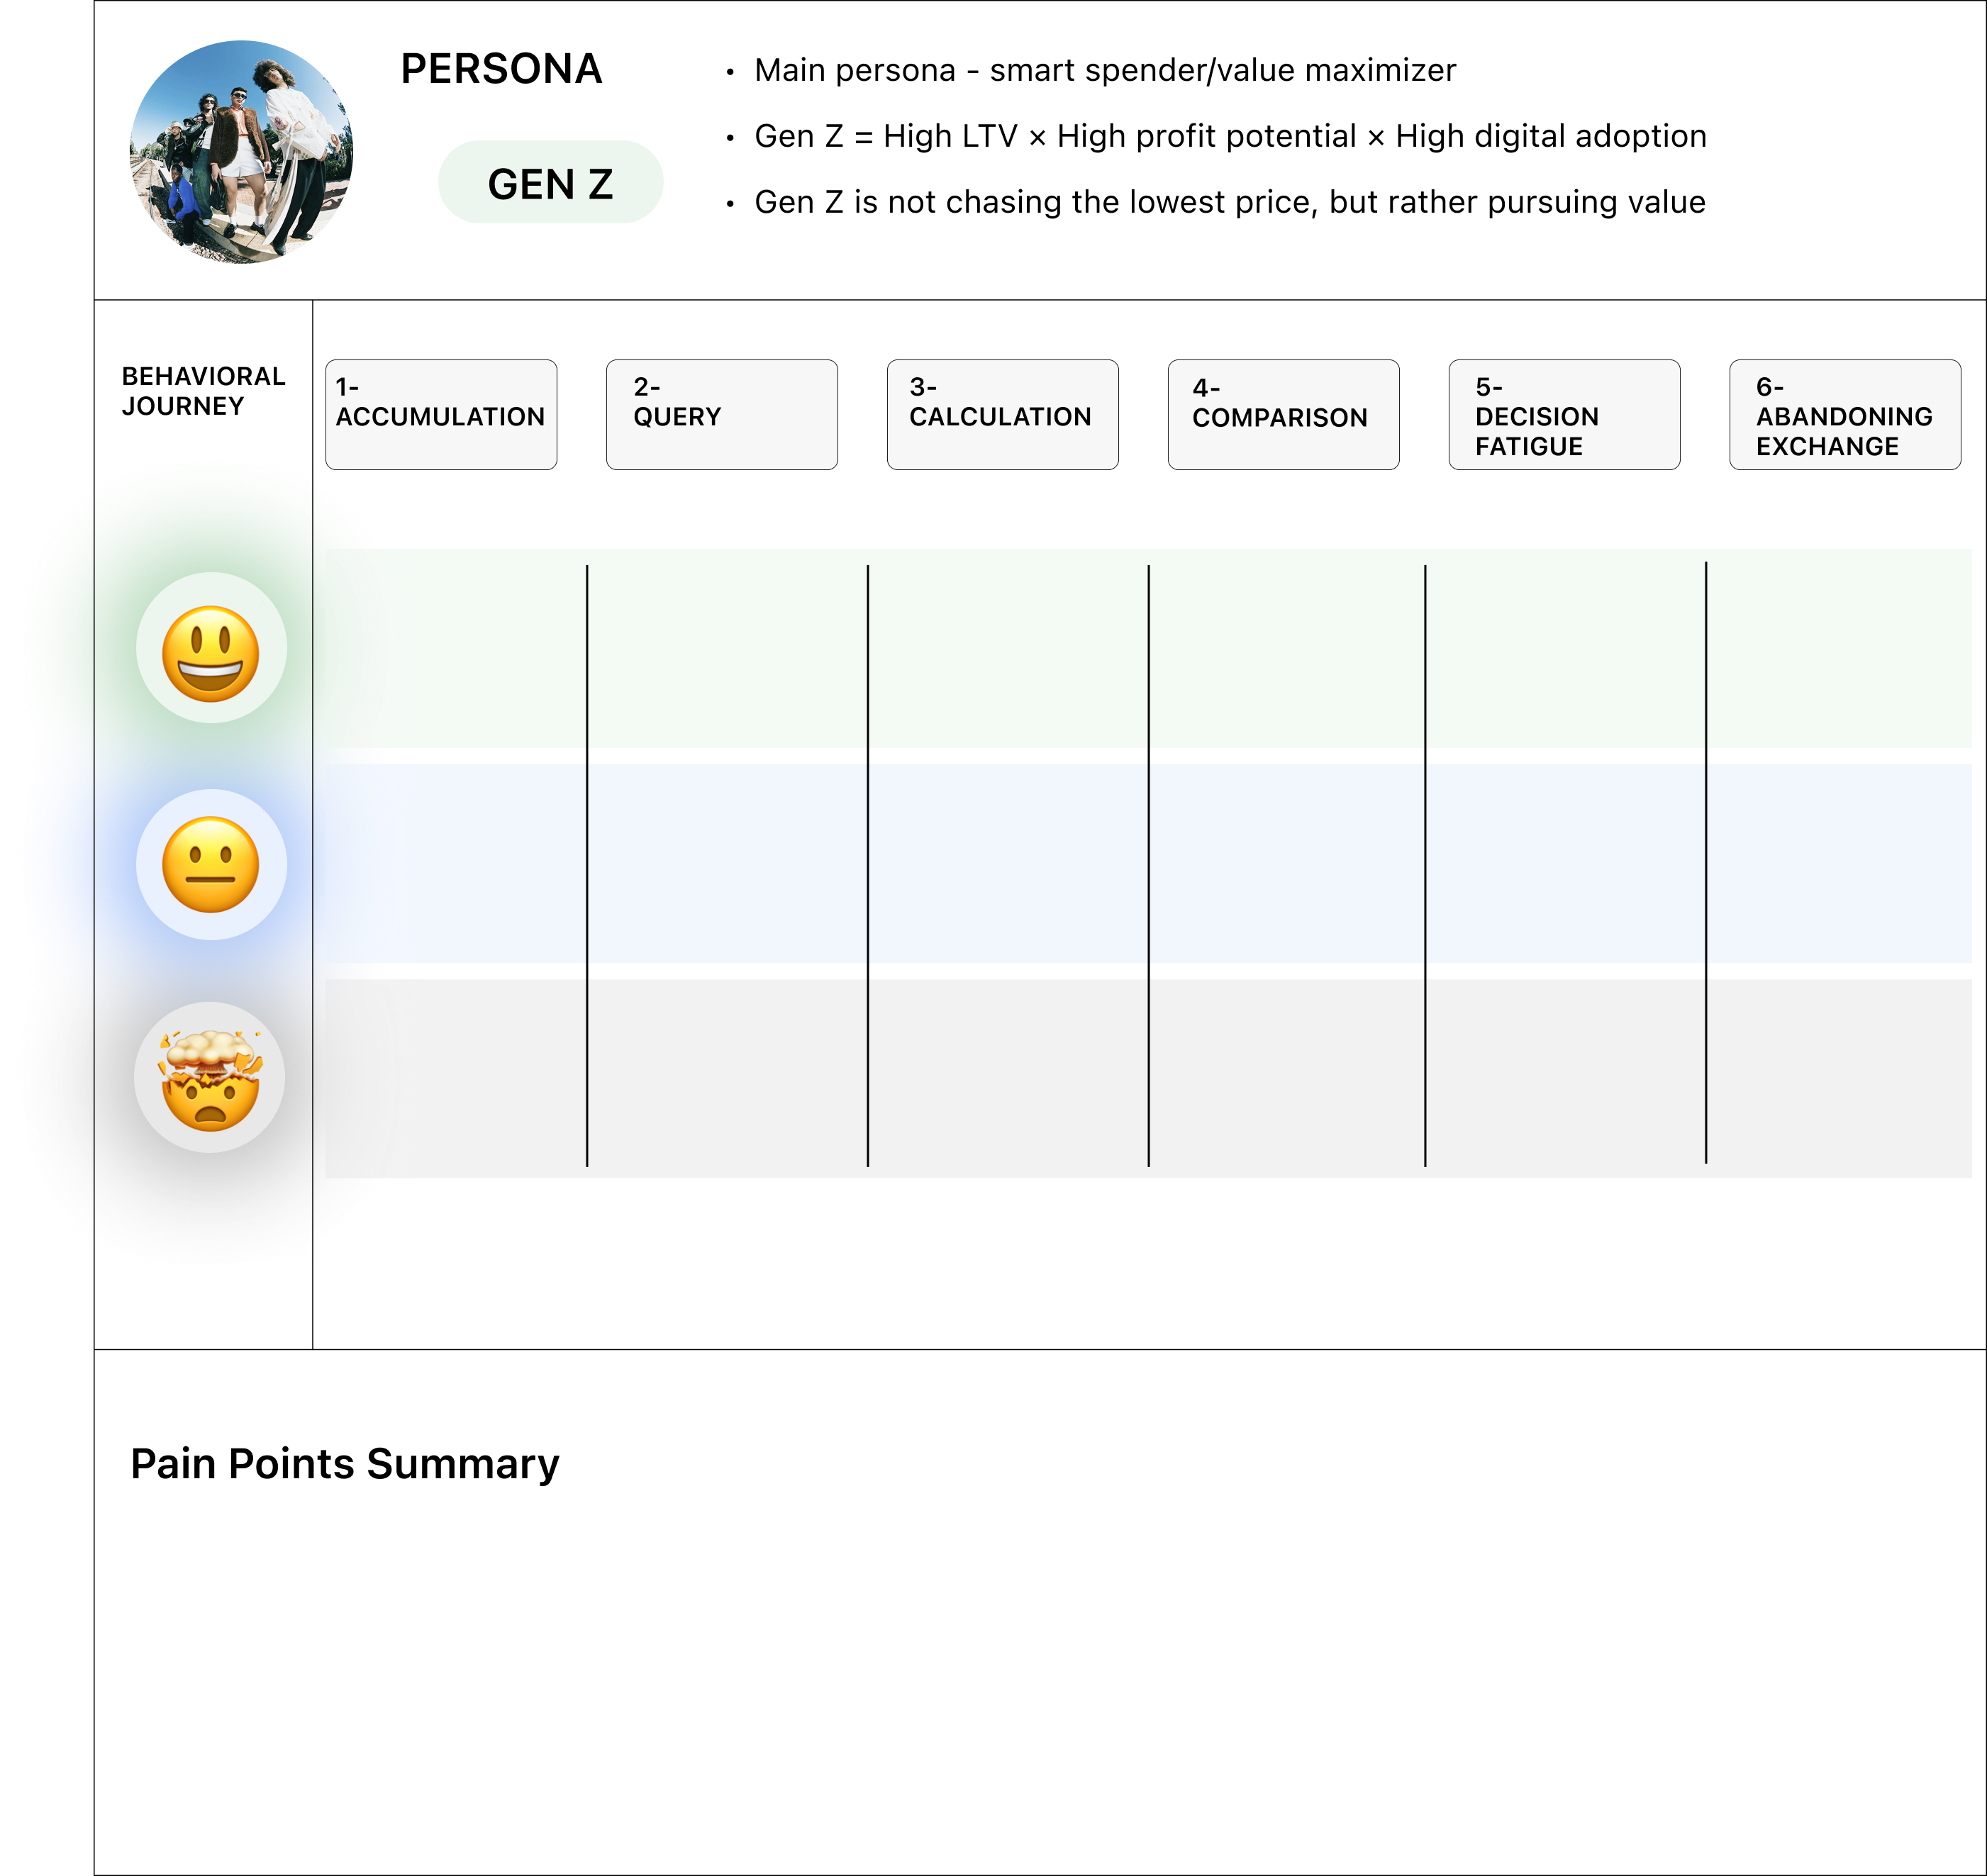
Journey Map
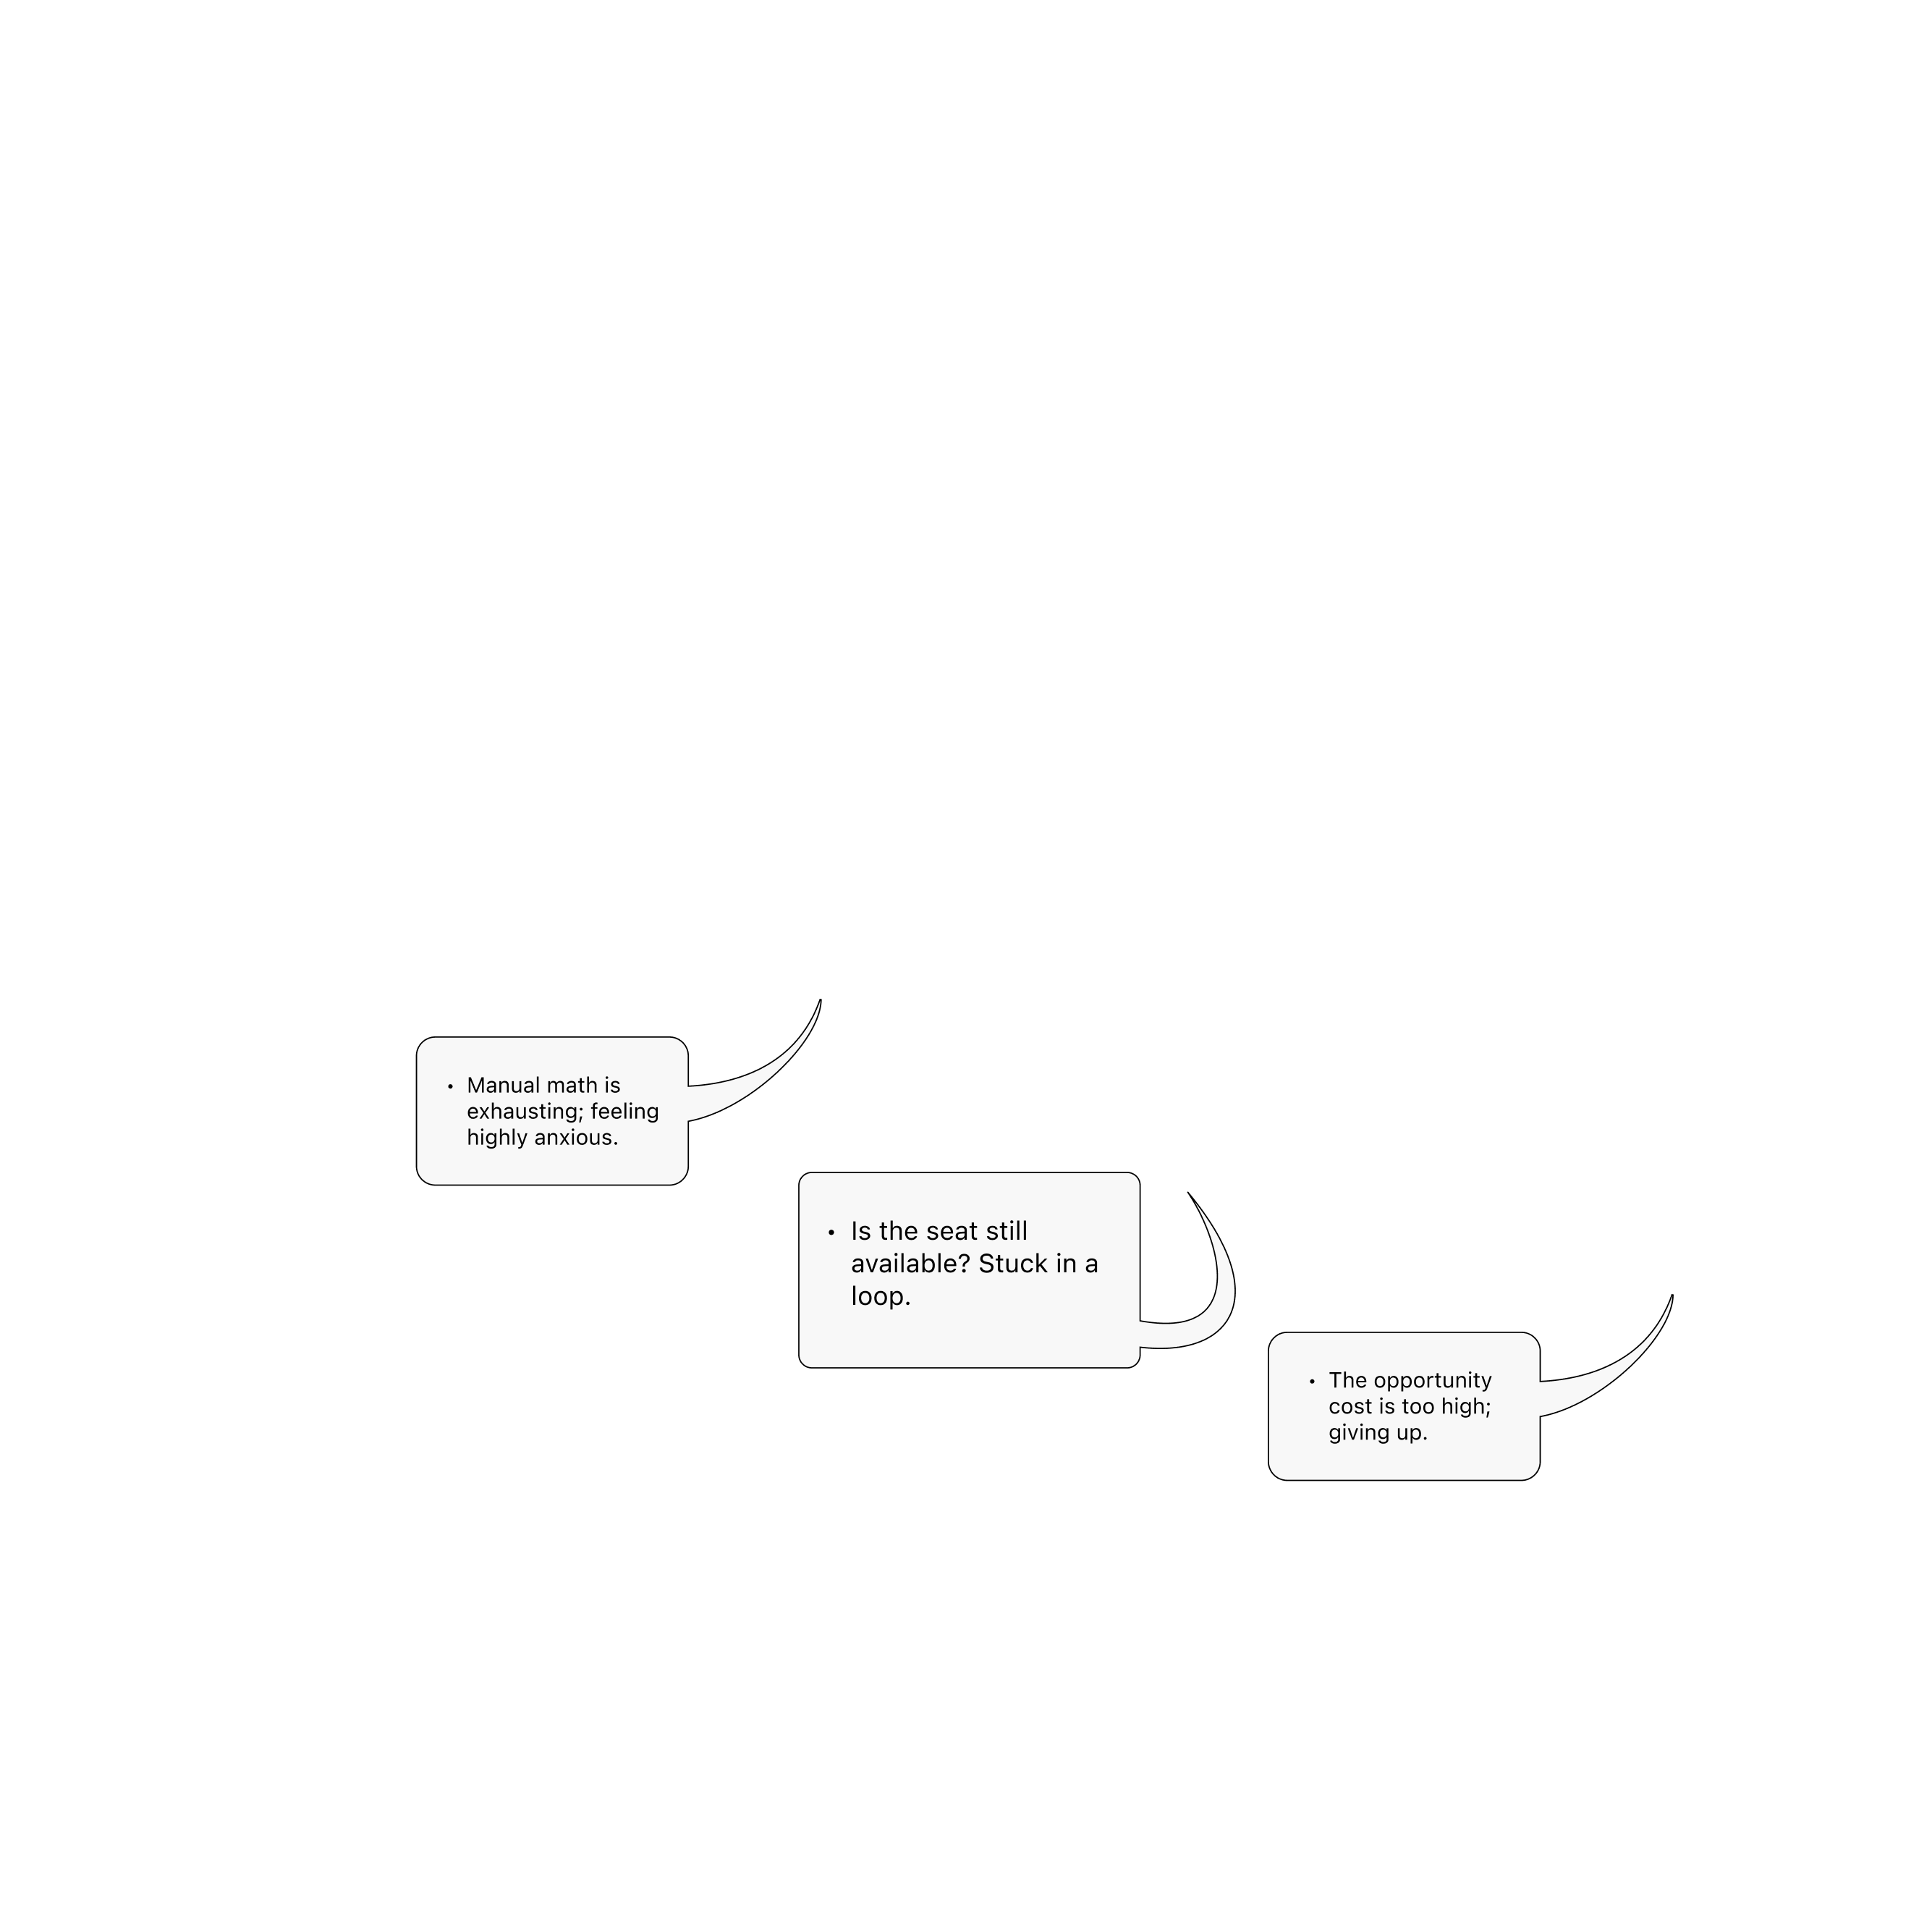
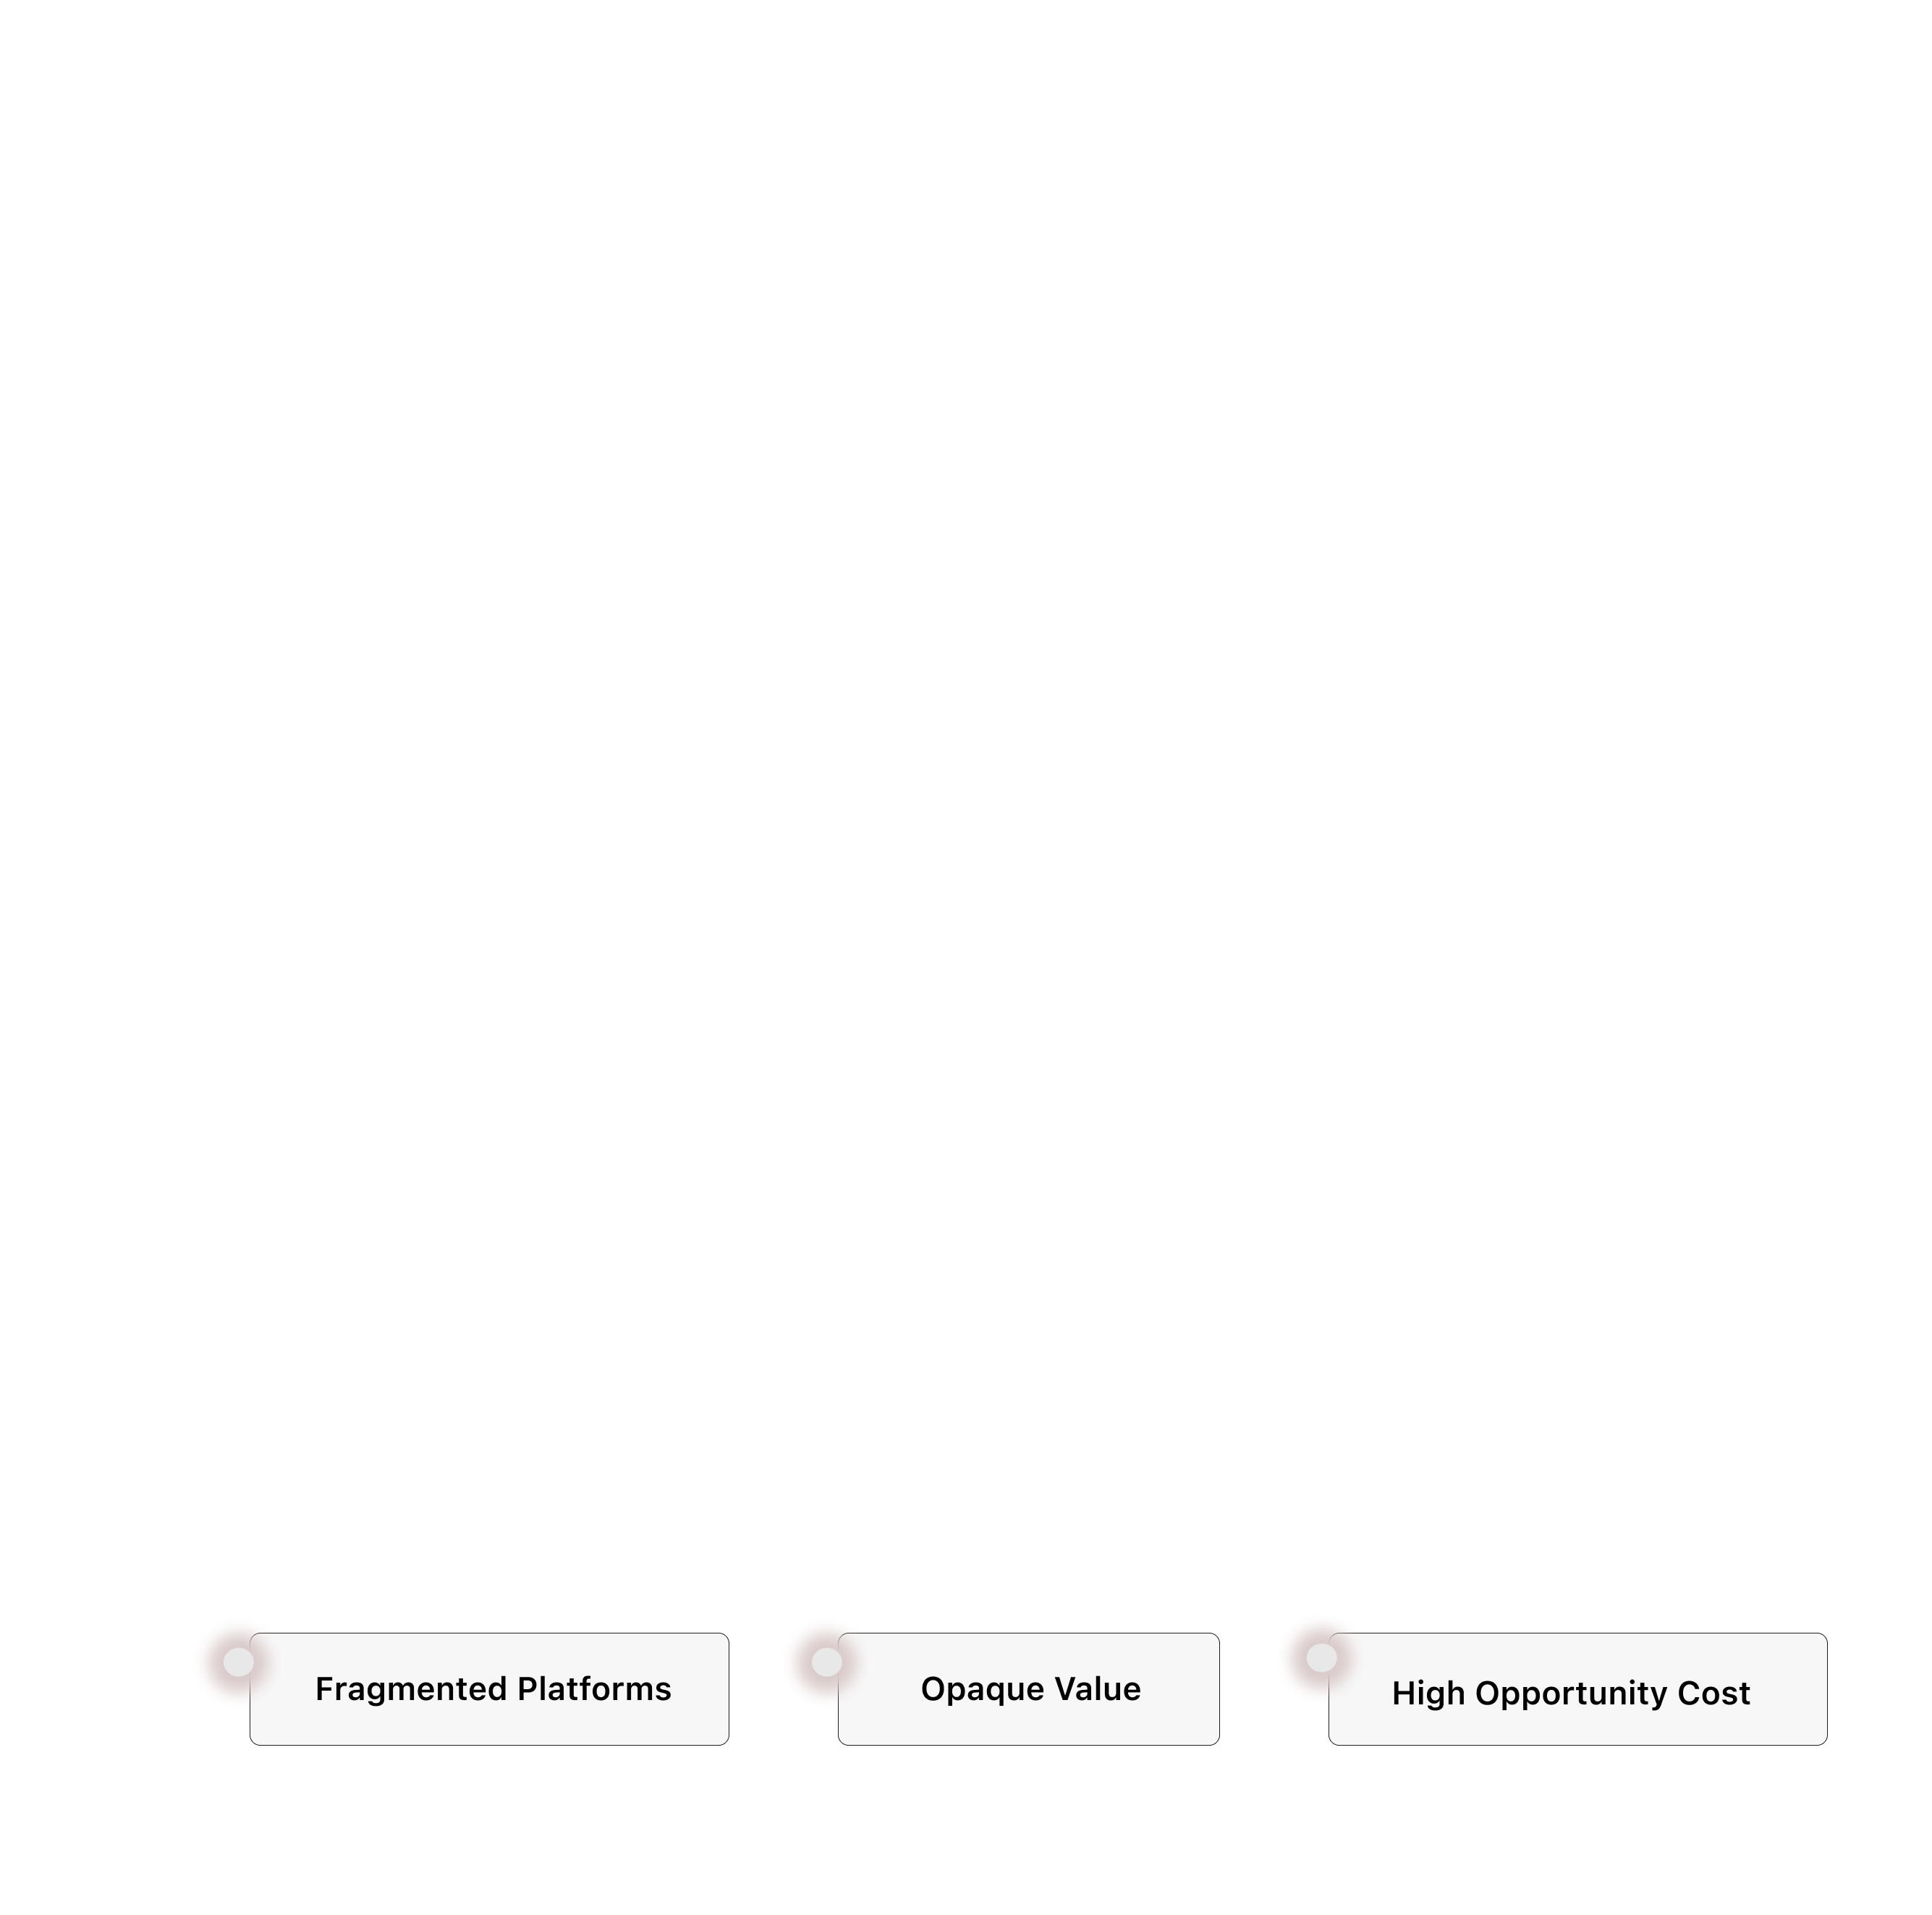
Navigating the Cognitive Chaos of High-Value Award Flight Redemption.


Outcome (AI-Enhanced Loyalty & Rewards Platform)
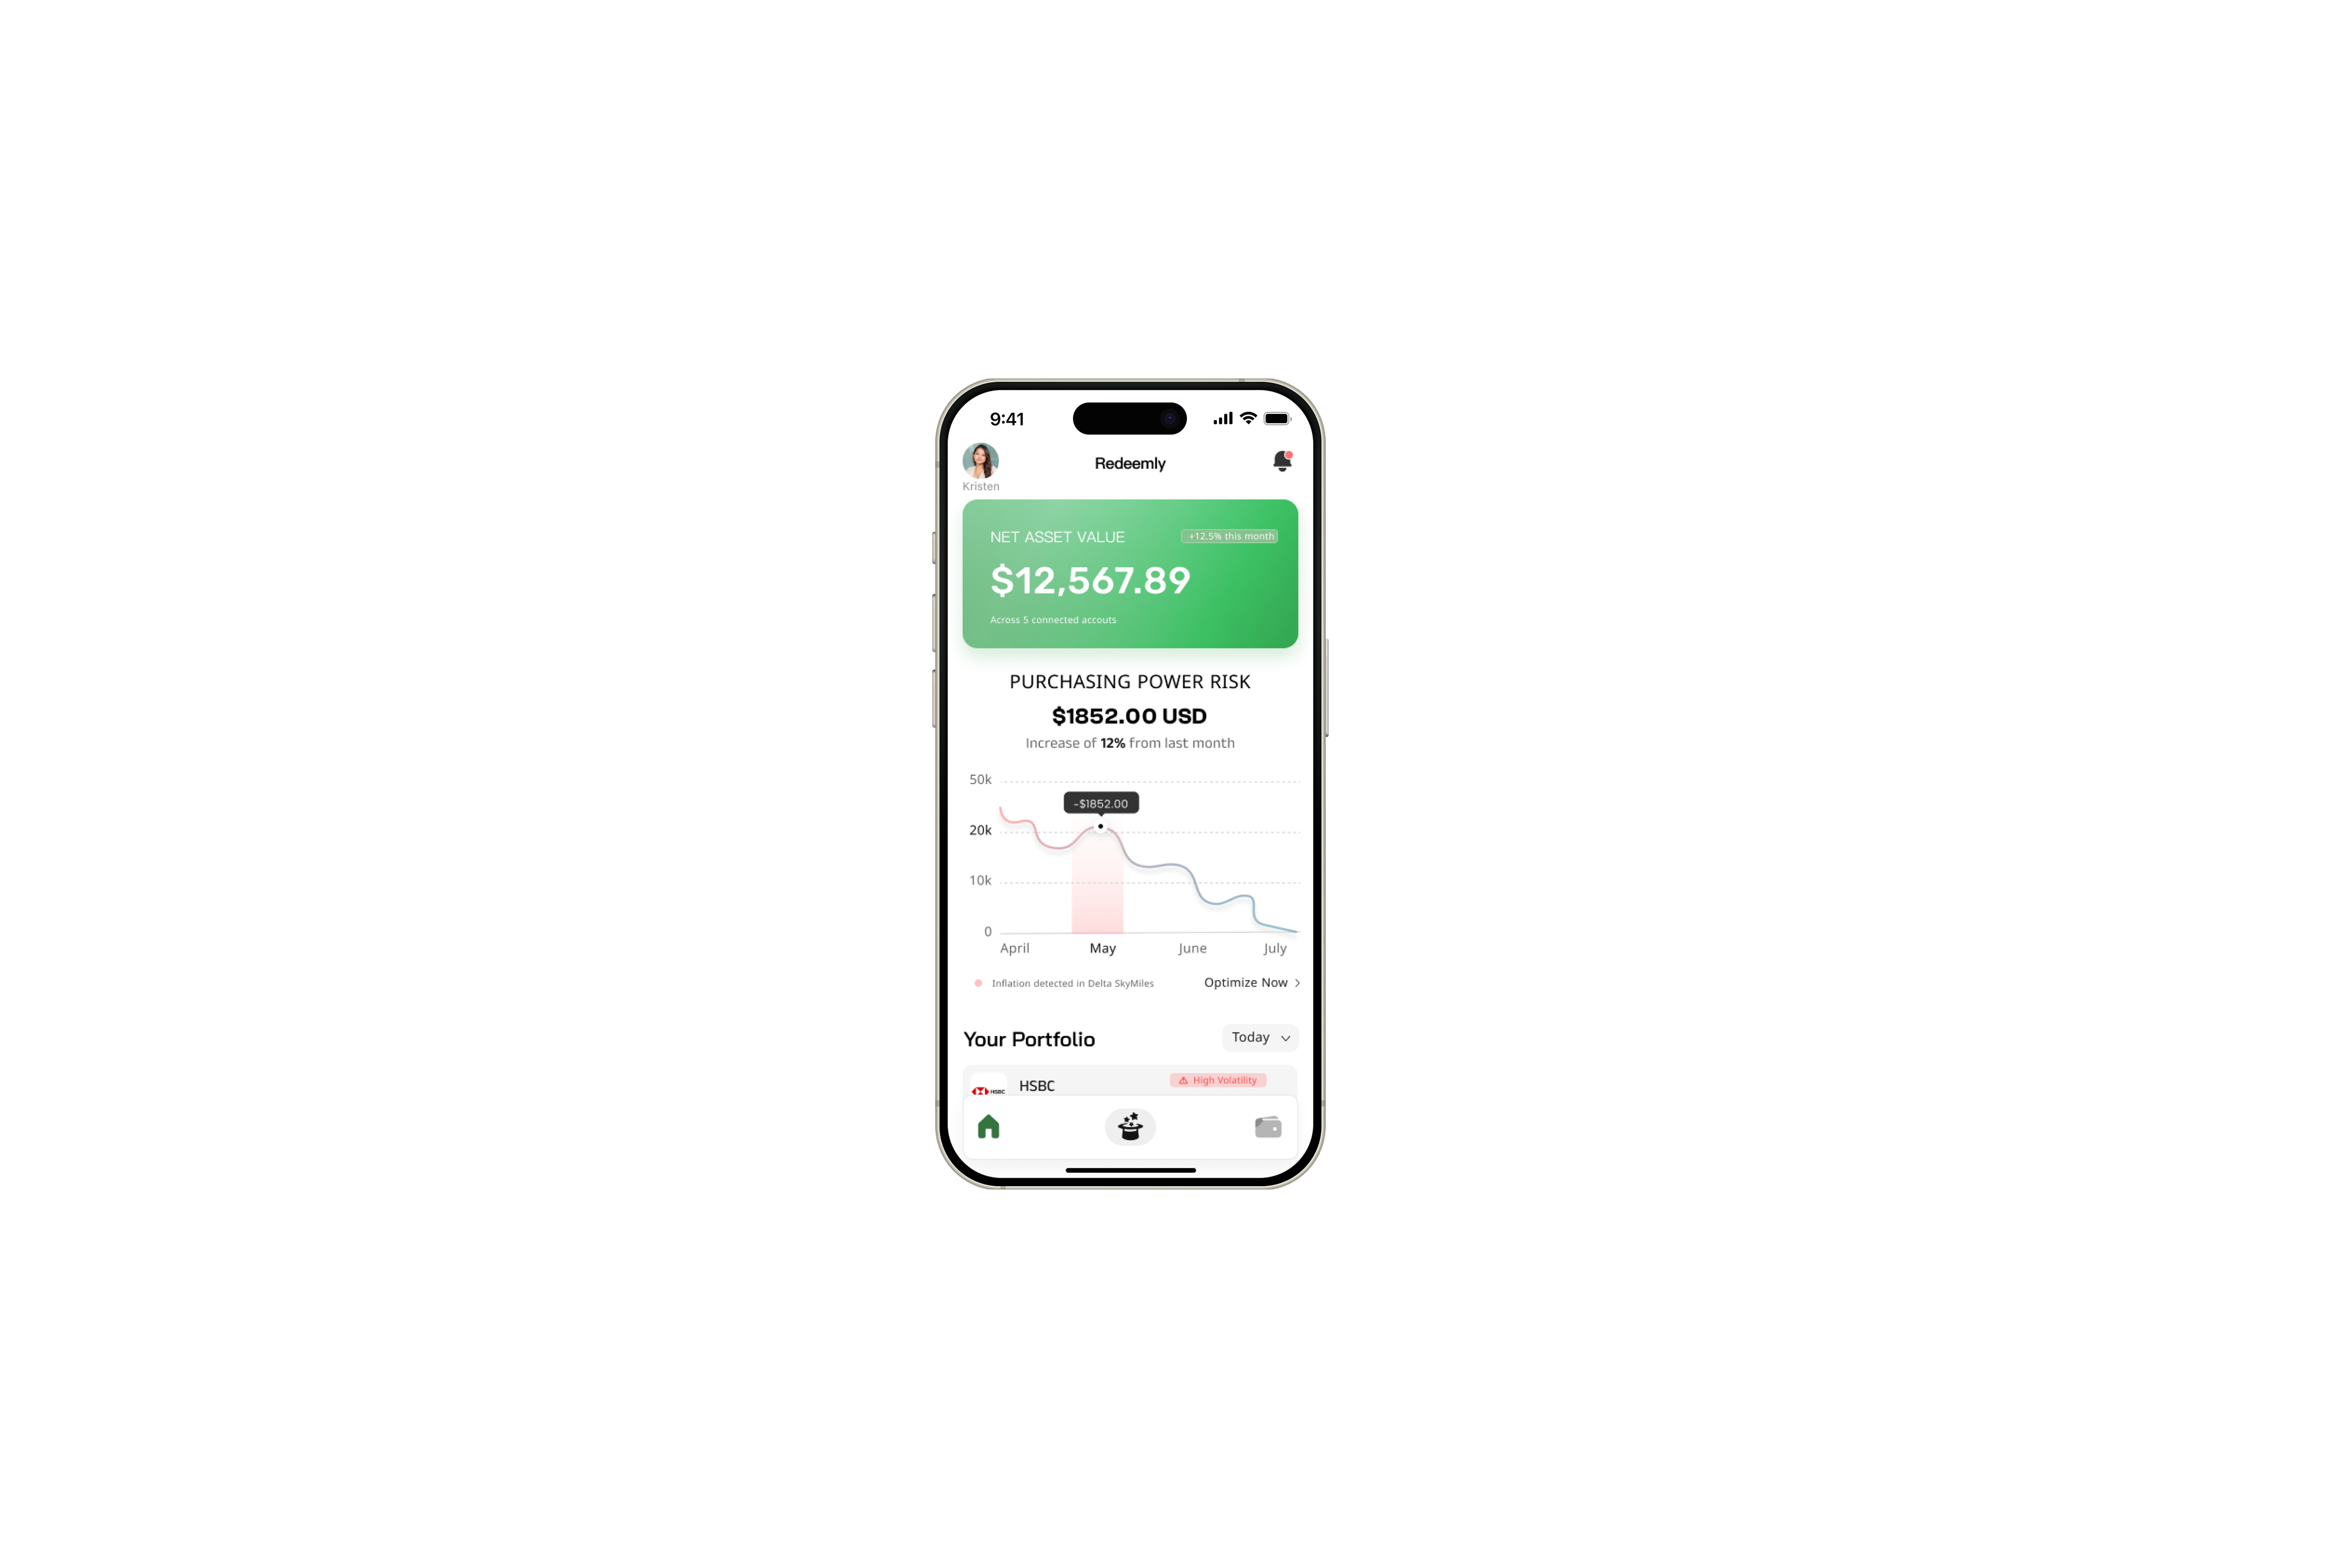


Asset Intelligence Dashboard
- NAV VisualizationRecontextualizes loyalty points as a unified USD Net Asset Value to establish financial parity.
- Loss Aversion EngineVisualizes purchasing power erosion through real-time "inflation" alerts to trigger user action.
- Risk-Stratified PortfolioCategorizes loyalty holdings by market volatility, prioritizing assets that require immediate optimization.
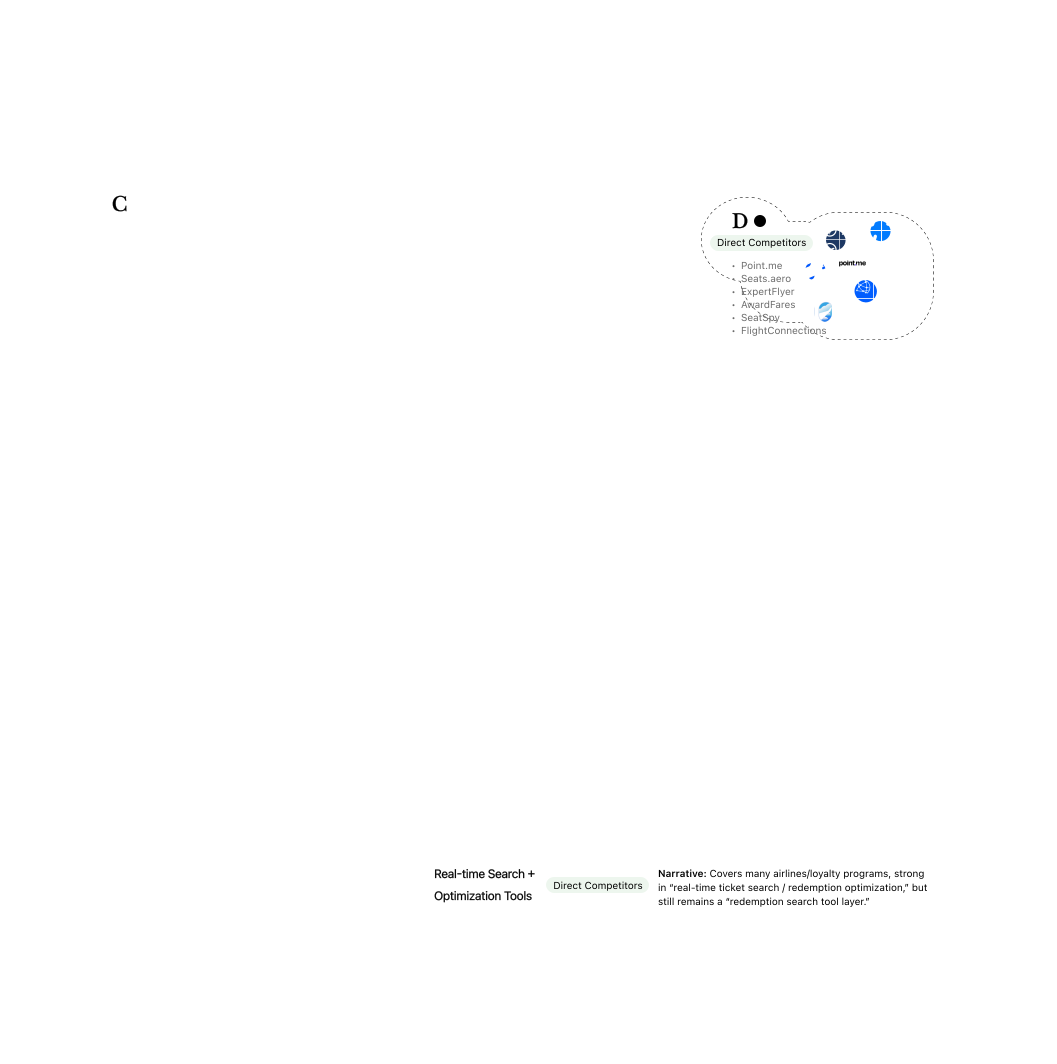
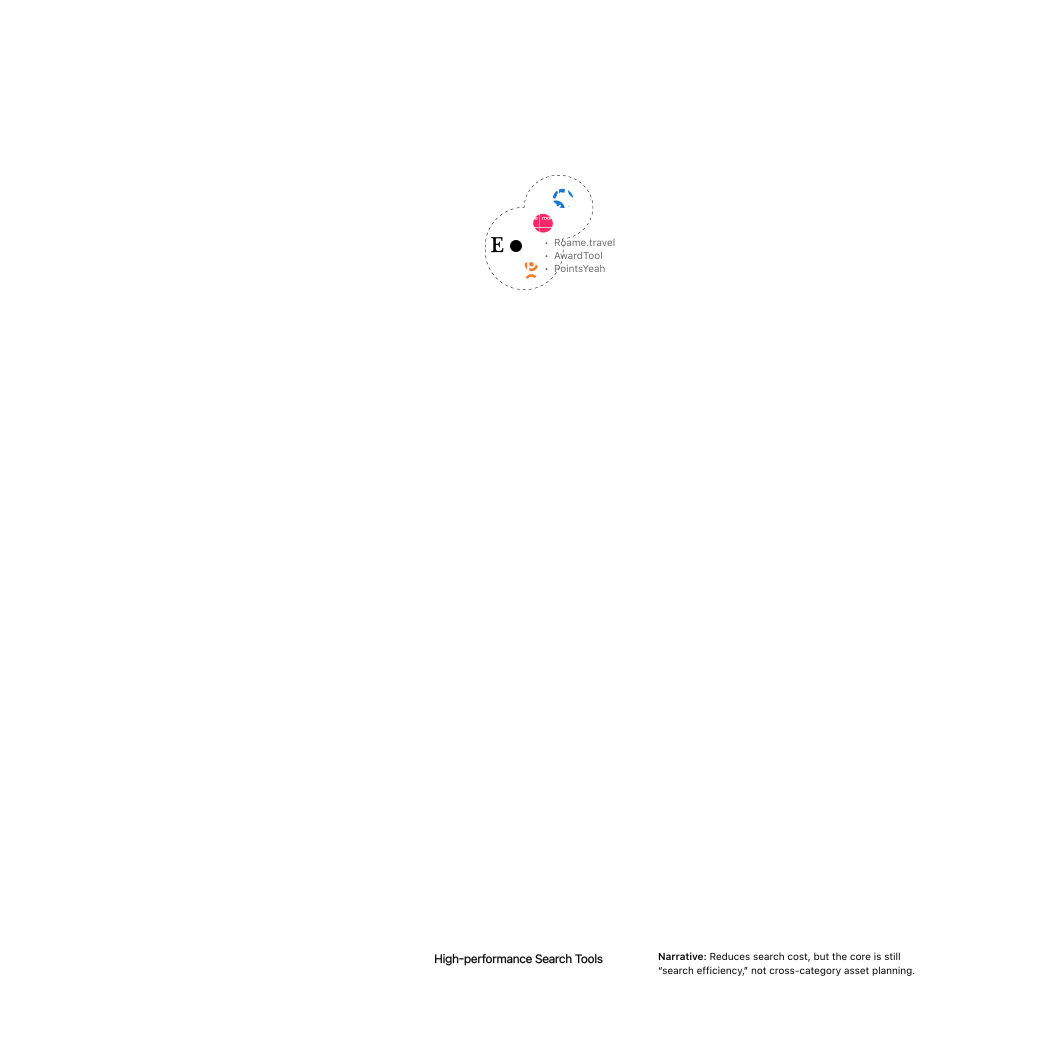
Competitive Points & Target Positioning


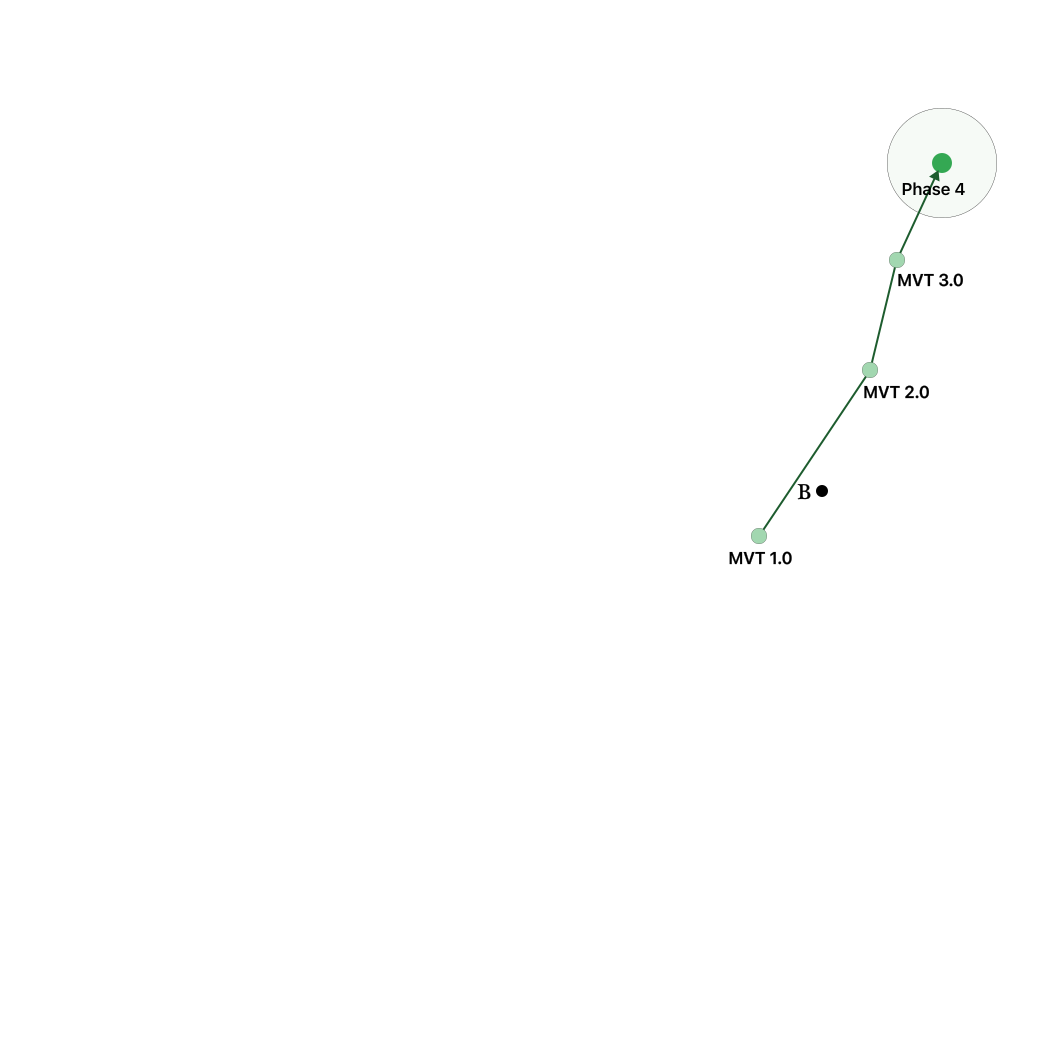
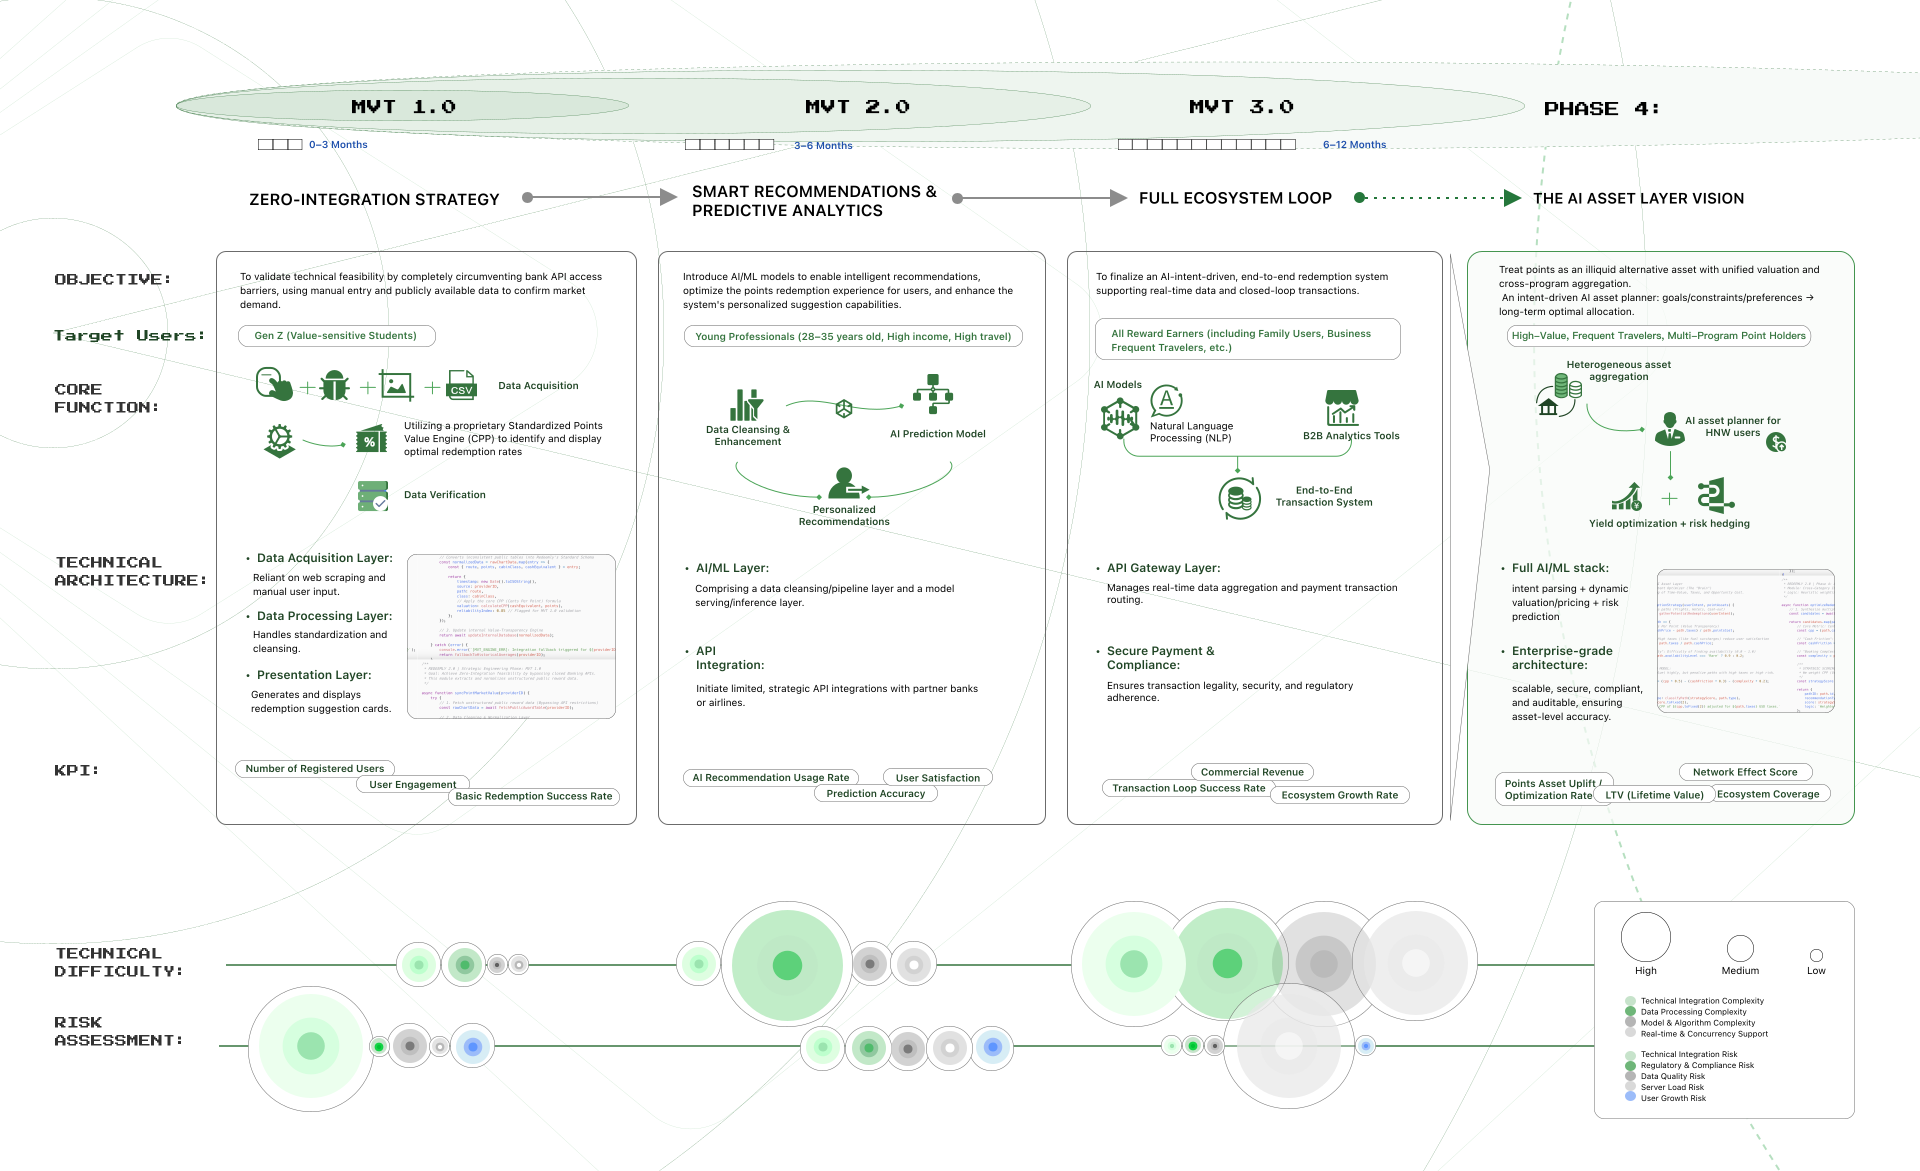
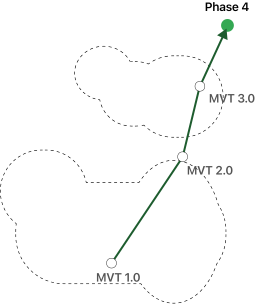
Feasibility Roadmap / MVT 1.0–3.0--Phase 4